Making the MINERvA Measurement
What happens to make a masterclass
The masterclass starts, optionally, with preparation in the classroom. There a student learns some background ideas to make it easier to understand the masterclass measurement. It goes something like this:

We will concentration on the middle box inside the green field: the data analysis and what flows from it.
Here is the outline of the analysis tasks:
- Your masterclass leader will give you a data group and assignment within the group.
- Go to the Student Start Page and find your masterclass.
- Open your spreadsheet and find your place in it, corresponding to your data assignment.
- Next open your data group in the start page (letter next to your institute name) and then go to your data assignment. This opens the Arachne event display.
- For each "Entry" or "Gate" (both names are used) go from Slice to Slice until you find an event with a short proton track and a long muon track and no extraneous indications that could render the event too "noisy" to analyze.
- Choose the short proton track. Then copy the proton kinematics and paste them into the spreadsheet.
- Do the same for the long muon track.
- If you do not find a "good" Slice in the Gate, mark that Entry as "background" with a 1 in the appropriate column. Leave all else blank in the row.
- The spreadsheet will tally all the momenta measured in your masterclass and make some interesting histograms for you to discuss.
Here is the same thing in a video screencast:
SCREENCAST MINERVA
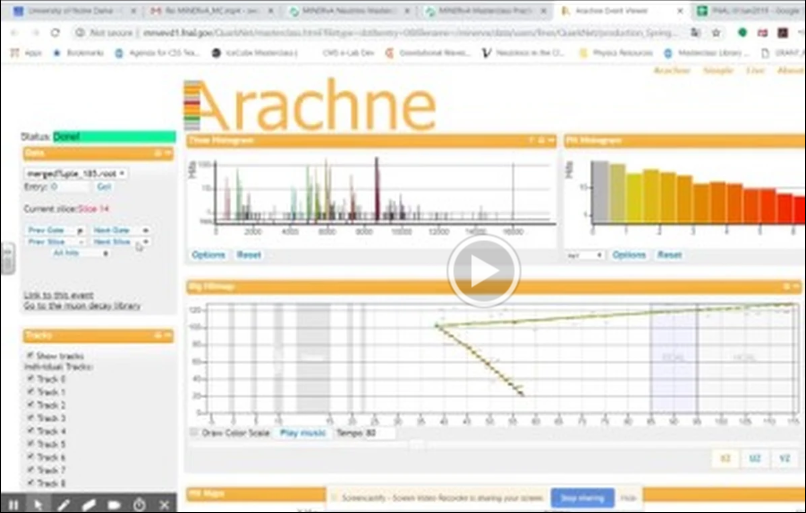
This screencast will guide you through the steps needed to analyze data and record results.
Of course, there are more details. To learn these go the Library (link on sidebar) and then navigate to:the MINERvA page using the image map. If you want to really get into it, go to:
- MINERvA Masterclass Documentation
- Understanding MINERvA Masterclass Results
- MINERvA Masterclass Slides.
